In this post I’m going to show you how to use openCV and some basic HSV color space analysis used to mask out non leaf pixels. We can use the mask to measure the leaf area in pixels. You can use basic trig to find out the pixel to millimeter value using the distance and angle of the field of view. I’ve broken my Jupyter notebook into smaller pieces to overcome the limitations of medium’s support for rendering long notebooks (though it did seem to render fine on mobile, I couldn’t see it properly on my MacBook Pro using Chrome). Anyway, I also have a full version of the notebook available for anyone interested.

Dependencies
We’re going to utilize the imutils convenience package to resize the images for processing as well as for finding our HSV calibration values. OpenCV will be used for preprocessing the image and pixel selection by range. We use matplotlib is used from rendering images and graphs.
[gist https://gist.github.com/TonsOfFun/bcde86d69e810f7eeb5b03f1fdbb3c45 /]
Leaf Masking
This is a basic function that converts the BGR (OpenCV is BGR, not RGB) image to HSV. Using the `leaf_lower` and `leaf_upper` HSV colorspace values defined using the range-detector helper tool found in imutils. These calibration settings work on both of my NestCams situated under the same type of HPS light. This is basically pulled from this PyImageSearch article on tracking a green ball.
[gist https://gist.github.com/TonsOfFun/75cc04248d534a88c6dbcfd98be20033#file-leaf_area_mask-py /]
The erosions and dilations are to cleanup any smaller blobs picked up by the HSV range. In the next blogpost we will go over how to do additional filtering by analyzing the contours and their sizes. I’m not going to apply that here since the results of the post processing on the mask seem adequate for this stage. We will be replacing this model with a custom trained TensorFlow mask RCNN model. Checkout this blogpost on making a toy detector that can output a pixel-wise mask.
[gist https://gist.github.com/TonsOfFun/e2e283b3a229a898e0fae217c276e48b#file-week_1-ipynb /]
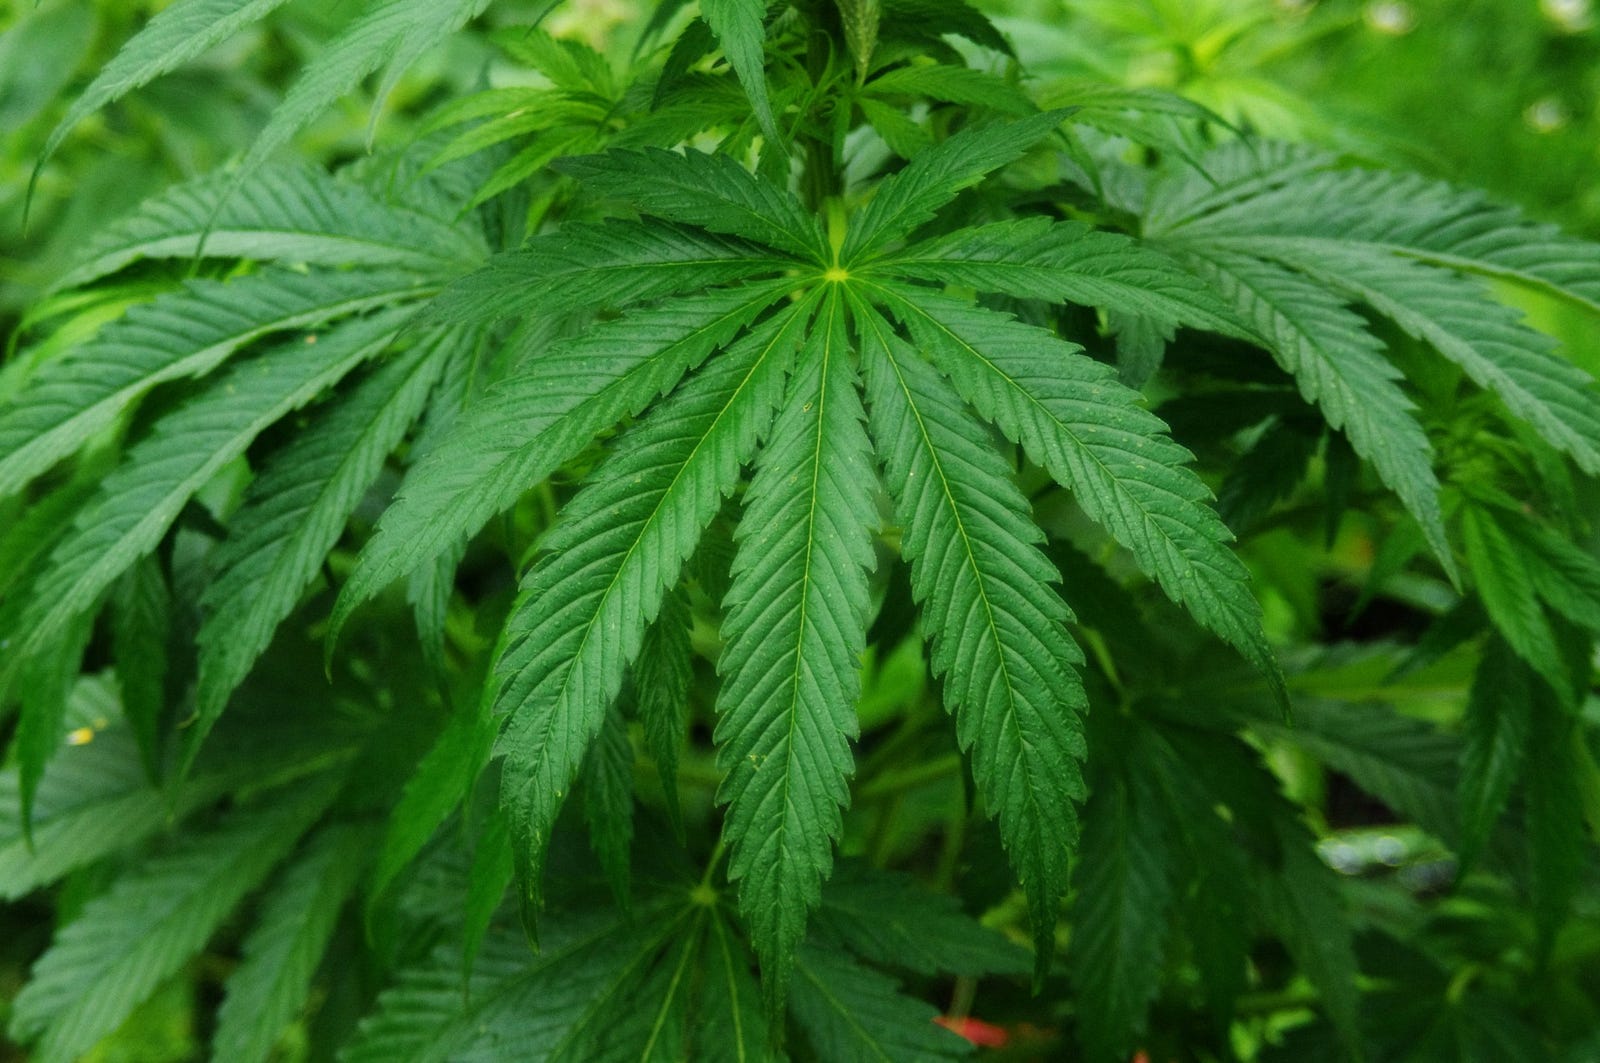
You can see the function working on the two sample images, above from week one and below from week 2. They represent the plants at two time periods 5 days apart. Now let’s checkout what insights the data has to offer.
[gist https://gist.github.com/TonsOfFun/e2e283b3a229a898e0fae217c276e48b#file-week_1-ipynb /]
Health Reports and Graphs
Below you can checkout a leaf growth report. 10 square inches or 30 square centimeters of growth assuming our camera was hung at the correct height and give or take some variance due to inconsistent leaf distances from the lens. This gives a cultivator great insight into the general health of their crop just by graphing growth. You might also notice that I scaled the images down for processing so the results would have to be scaled up proportionately. That’s an exercise for another time as this post is just to get the concept of monitoring and graphing plant growth with smart cameras.
[gist https://gist.github.com/TonsOfFun/05abcc852c53b31b3bf963cdd5b81a78#file-report_printout-ipynb /]
We can now have the ability to provide reports on performance as well as alerts when growth has plateaued or even dropped off which is a clear sign of stress in any plant. We can also provide historical performance reviews so a cultivator can see how the current crop is vegging in comparison with previous crops at the same stage of growth.
Let’s plot these data points from our two leaf area analyses. Since we only have our two data points from this time series our line graph will be a little boring, but you can imagine the growth being more engaging when plotting a point every minute instead of every 5 days. A realtime growth chart would include oscillations from the circadian rhythms induced by the light cycles, as well as fluctuating from variable environmental conditions. The decentralized AI will have to compensate for variability dynamically at each camera.
[gist https://gist.github.com/TonsOfFun/4b4a7a0f6d4708ba46a89c457c41a115#file-growth_graph-ipynb /]
With this functionality we increase the farmers awareness of problem areas in there grow sites and give them metrics to back their business’s performance overtime. We can now take photos of cannabis plants and produce metrics on our devices. It’s the first step on our path to a decentralized cannabis AI and there is enormous potential value in a trusted data source of cannabis cultivation metrics from seed to harvest. I’ll be putting out an article later this month talking about GreenThumb IO’s plans to empower the farmers with their own crop data with GTIO Security Tokens.